Free Access
Fig. 4
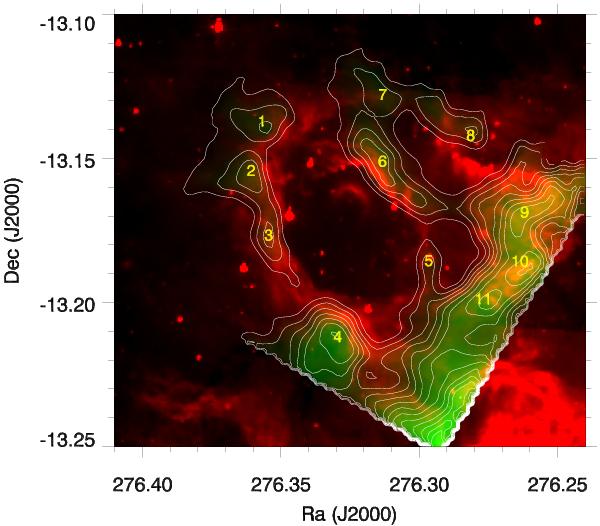
JCMT 12CO J = 3−2 emission (in green) integrated between 40 and 60 km s-1. The contour levels of the 12CO J = 3−2 emission increase from 50.0 to 252.9 by 16.9 K km s-1. Red is the 8 μm emission. The yellow numbers are the ID of molecular cores.
Current usage metrics show cumulative count of Article Views (full-text article views including HTML views, PDF and ePub downloads, according to the available data) and Abstracts Views on Vision4Press platform.
Data correspond to usage on the plateform after 2015. The current usage metrics is available 48-96 hours after online publication and is updated daily on week days.
Initial download of the metrics may take a while.