Free Access
Fig. 1
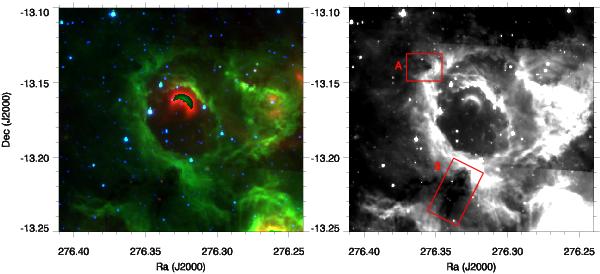
Left: mid-IR emission of the IR dust bubble N22: Spitzer three-color image (4.5 μm = blue, 8 μm = green, and 24 μm = red). Right: the background shows the Spitzer-IRAC 8 μm emission. The two rectangles show the location of two IRDCs, which are named A and B.
Current usage metrics show cumulative count of Article Views (full-text article views including HTML views, PDF and ePub downloads, according to the available data) and Abstracts Views on Vision4Press platform.
Data correspond to usage on the plateform after 2015. The current usage metrics is available 48-96 hours after online publication and is updated daily on week days.
Initial download of the metrics may take a while.