Free Access
Fig. 9
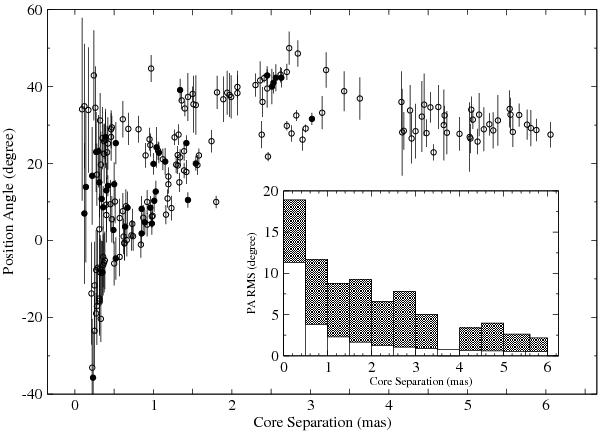
Position angle plotted as a function of core separation for all jet components seen at 15 (open) and 22 GHz (filled). The inset histogram is a plot of the scatter of PAs (shaded) in each bin (0.5 mas) with comparison to the errors (blank) from the often quoted 1/5 of the beam size (see text for details).
Current usage metrics show cumulative count of Article Views (full-text article views including HTML views, PDF and ePub downloads, according to the available data) and Abstracts Views on Vision4Press platform.
Data correspond to usage on the plateform after 2015. The current usage metrics is available 48-96 hours after online publication and is updated daily on week days.
Initial download of the metrics may take a while.