Fig. 6
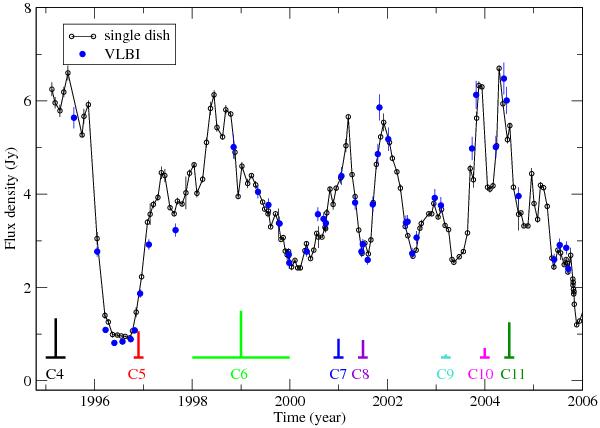
Light curves of PKS 1749+096 from total VLBI flux density data (filled circles) and single-dish flux density data (open circles, UMRAO data) at 15 GHz. The fitted component ejection time is indicated by the vertical lines, whose length is proportional to the flux density of each component (C4–C7: 15 GHz, C8–C11: 22 GHz) when first seen. Horizontal bars along the time axis denote the uncertainty of the ejection time of each labeled component.
Current usage metrics show cumulative count of Article Views (full-text article views including HTML views, PDF and ePub downloads, according to the available data) and Abstracts Views on Vision4Press platform.
Data correspond to usage on the plateform after 2015. The current usage metrics is available 48-96 hours after online publication and is updated daily on week days.
Initial download of the metrics may take a while.