Free Access
Fig. 7
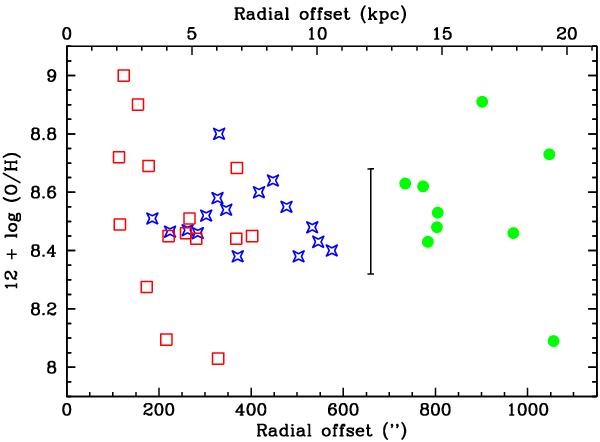
The radial dependence of the oxygen abundance (12 + log(O/H)) from the observed PN modelled by Cloudy (Table 8). The points are coded for the three regions as in Fig. 2: F56 by open stars (blue); F42 as open squares (red); F34 by filled circles (green). A representative error bar on the O abundance is shown.
Current usage metrics show cumulative count of Article Views (full-text article views including HTML views, PDF and ePub downloads, according to the available data) and Abstracts Views on Vision4Press platform.
Data correspond to usage on the plateform after 2015. The current usage metrics is available 48-96 hours after online publication and is updated daily on week days.
Initial download of the metrics may take a while.