Fig. 10
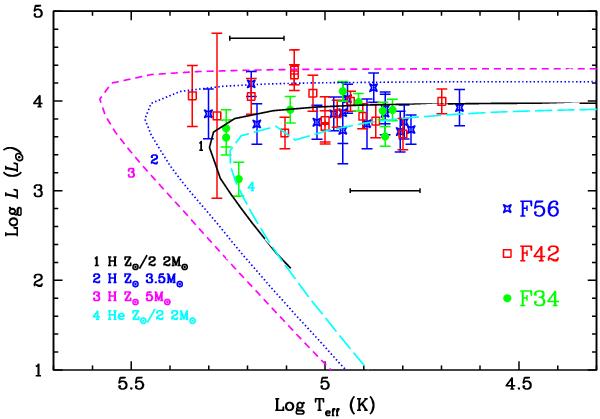
An HR diagram showing the black body log L vs. log Teff coordinates of the central stars of the PNe with spectra modelled by Cloudy (Table 8) and a selection of low mass H and He burning model tracks from Vassiliadis & Wood (1997). The points are coded (and coloured) for the three regions (F42, F56 and F34) as in Fig. 2. Representative error bars on temperature at higher and lower temperatures are shown; the error bars in log L were computed from the errors on dereddened absolute Hβ flux in Table 12.
Current usage metrics show cumulative count of Article Views (full-text article views including HTML views, PDF and ePub downloads, according to the available data) and Abstracts Views on Vision4Press platform.
Data correspond to usage on the plateform after 2015. The current usage metrics is available 48-96 hours after online publication and is updated daily on week days.
Initial download of the metrics may take a while.