Fig. 3
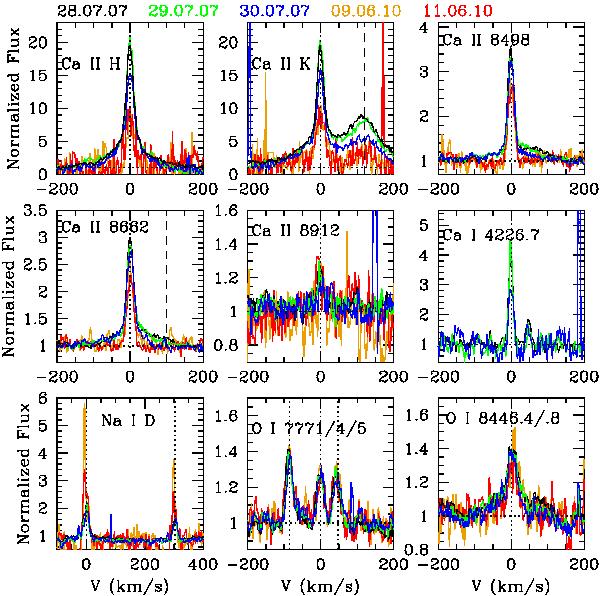
Some of the Ca I, Ca II, Na I, and O I lines seen in emission during the quiescence phases (pre- and post-outburst). The zero velocity is marked by a dotted line (in the cases of the Na I D and O I triplet, we mark the zero velocity for each resolved line). The dashed lines in the Ca II K and Ca II 8662 Å lines mark the position of the Balmer Hϵ and Paschen 13 lines, respectively. The weaker line redwards of Ca I 4226 is Fe I 4227. Different colors mark different dates as in Fig. 1.
Current usage metrics show cumulative count of Article Views (full-text article views including HTML views, PDF and ePub downloads, according to the available data) and Abstracts Views on Vision4Press platform.
Data correspond to usage on the plateform after 2015. The current usage metrics is available 48-96 hours after online publication and is updated daily on week days.
Initial download of the metrics may take a while.