Free Access
Fig. 12
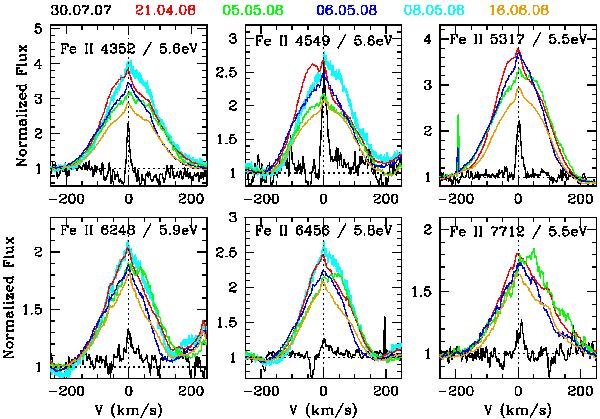
Some of the Fe II lines seen in emission during the outburst phase. The zero velocity is marked by a dotted line. For comparison, the quiescence spectrum of 2007 July 30 is displayed. The color code is as in Fig. 5.
Current usage metrics show cumulative count of Article Views (full-text article views including HTML views, PDF and ePub downloads, according to the available data) and Abstracts Views on Vision4Press platform.
Data correspond to usage on the plateform after 2015. The current usage metrics is available 48-96 hours after online publication and is updated daily on week days.
Initial download of the metrics may take a while.