Free Access
Fig. 1
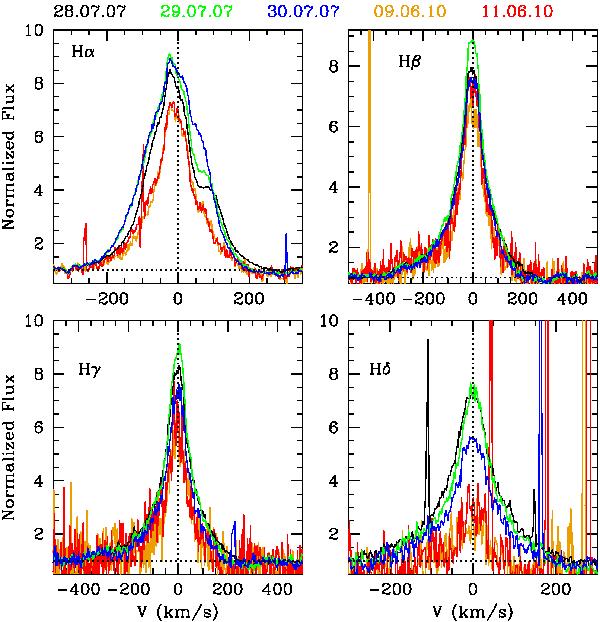
H lines during the quiescence phases (pre- and post-outburst). The zero velocity is marked by a dotted line. Different colors represent the observations on different dates (black for 2007 July 28, green for 2007 July 30, blue for 2007 July 30, orange for 2010 June 9, and red for 2010 June 11).
Current usage metrics show cumulative count of Article Views (full-text article views including HTML views, PDF and ePub downloads, according to the available data) and Abstracts Views on Vision4Press platform.
Data correspond to usage on the plateform after 2015. The current usage metrics is available 48-96 hours after online publication and is updated daily on week days.
Initial download of the metrics may take a while.