Fig. A.1
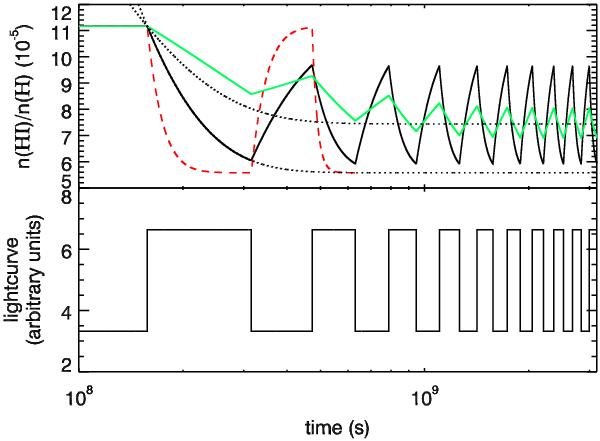
In the upper panel, simulations of the fraction of H in H i are plotted for a periodic step function light-curve with Δt = 1.6 × 10⁸ s (shown in the lower panel). The hydrogen number density of the thick black line was chosen to give a recombination timescale equal to half the period of the lightcurve. The red dashed line has a timescale that is 4 times shorter, and the green line has a timescale that is 4 times longer. The dotted black lines are analytic solutions for a flux change f = 1 (lower line) and f = 0.5 (upper line).
Current usage metrics show cumulative count of Article Views (full-text article views including HTML views, PDF and ePub downloads, according to the available data) and Abstracts Views on Vision4Press platform.
Data correspond to usage on the plateform after 2015. The current usage metrics is available 48-96 hours after online publication and is updated daily on week days.
Initial download of the metrics may take a while.