Fig. 5
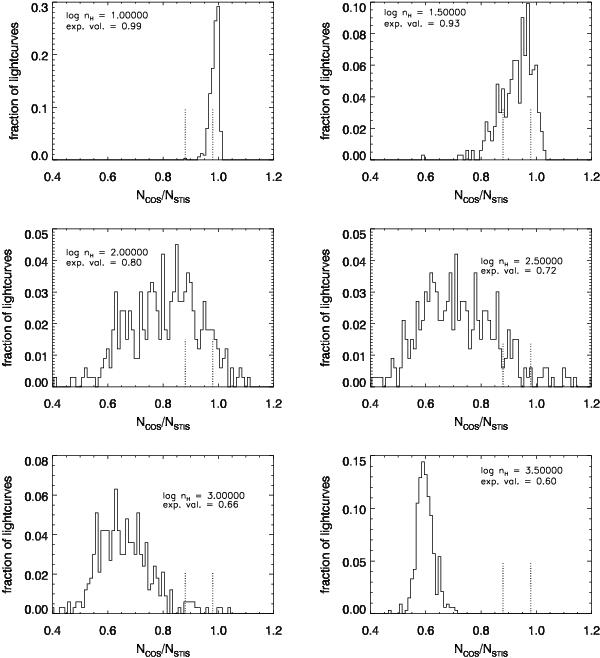
Determining the upper limit for nH of the absorber. This example shows the results for trough T2, based on the C iv column density measurements. For each of the 935 simulated light curves (see Sect. 5), we explicitly solve the time-dependent photoionization equations and calculate the expected ratio of C iv column density over a time period equal to the differences between the STIS and COS epochs. Each panel represents the fractional solution distribution of N(C iv)COS/N(C iv)STIS for a given log (nH) (cm-3), which increases in the panels from left to right and top to bottom. The vertical dashed lines show the positive and negative 1σ errors on the measured value. We determine an nH upper limit by increasing nH until more than 99% of the calculated N(C iv)COS/N(C iv)STIS are outside the error bars. In this example, we find nH < 103.2 cm-3.
Current usage metrics show cumulative count of Article Views (full-text article views including HTML views, PDF and ePub downloads, according to the available data) and Abstracts Views on Vision4Press platform.
Data correspond to usage on the plateform after 2015. The current usage metrics is available 48-96 hours after online publication and is updated daily on week days.
Initial download of the metrics may take a while.