Free Access
Fig. 4
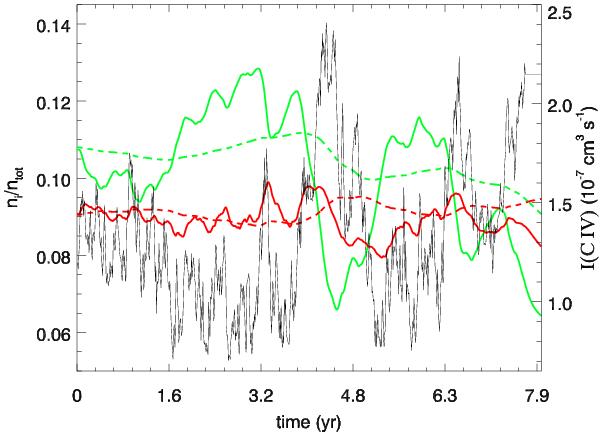
Simulations of C iv/C (green) and N v/N (red) versus time for one lightcurve in the sample. The solid lines are for a density nH = 103.5 and the dashed lines are for nH = 102.5. The black line is the ionization rate per particle for C iv and is propotional to the simulated lightcurve for this example.
Current usage metrics show cumulative count of Article Views (full-text article views including HTML views, PDF and ePub downloads, according to the available data) and Abstracts Views on Vision4Press platform.
Data correspond to usage on the plateform after 2015. The current usage metrics is available 48-96 hours after online publication and is updated daily on week days.
Initial download of the metrics may take a while.