Fig. 3
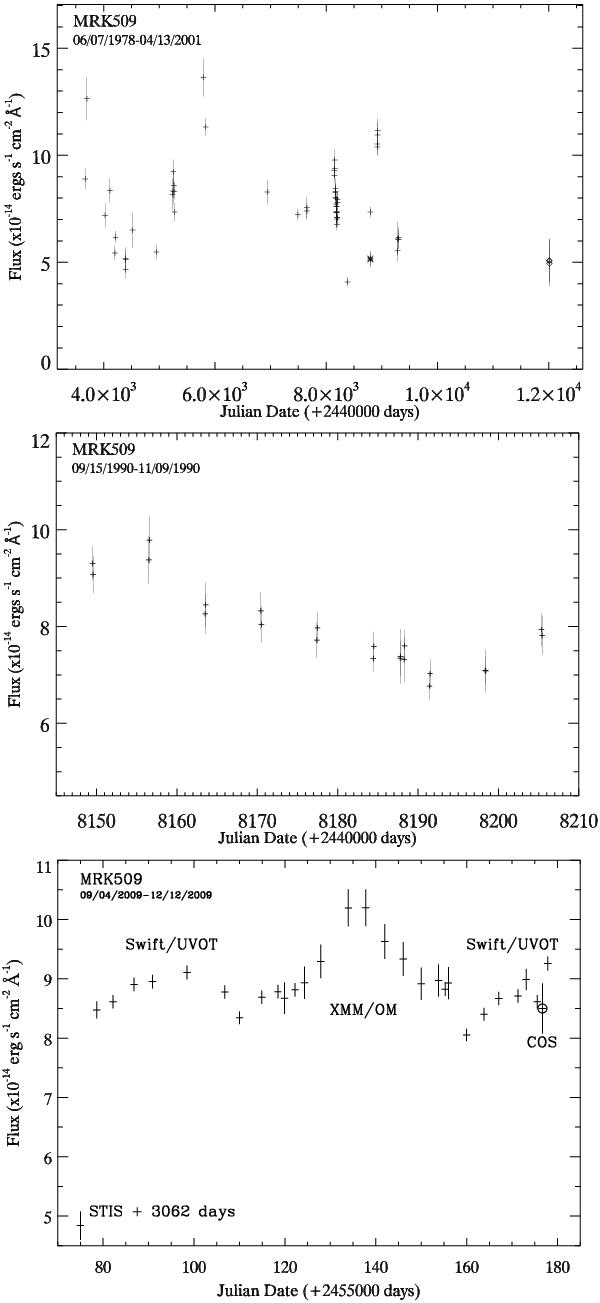
MRK 509 UV lightcurve monitoring at 1401Å. The top panel shows all the UV flux monitoring observations of Mrk 509 prior to our campaign. Even in this sparse sampling, it is clear that the UV lightcurve of Mrk 509 changes by at least a factor of 3.5. The center panel gives a blow-up of the only intensive short-term monitoring (September − November 1990) before our campaign. The characteristics of this intensively monitored lightcurve are similar to the one we measured during our 2009 campaign shown in the bottom panel, where the COS observation is marked with a circle.
Current usage metrics show cumulative count of Article Views (full-text article views including HTML views, PDF and ePub downloads, according to the available data) and Abstracts Views on Vision4Press platform.
Data correspond to usage on the plateform after 2015. The current usage metrics is available 48-96 hours after online publication and is updated daily on week days.
Initial download of the metrics may take a while.