Fig. 2
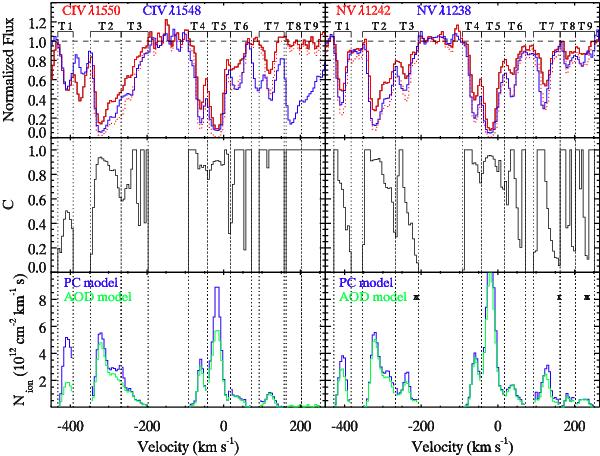
The upper panel presents the line profiles associated to C iv and N v in the COS spectrum. The dotted red line, only plotted in regions free of known blending in the weakest transition (red line), represents the expected residual intensity in the stronger transition (blue line) assuming an absorber totally covering the emission source (AOD model,  ). The central panel shows the derived covering solution obtained for C iv and N v as a function of the radial velocity. A high covering is observed in most components of the outflow, while trough T1 presents a lower covering in both C iv and N v. The low covering derived in troughs T6 and T7 of N v is most likely due to a shift in the wavelength solution. In the lower panel we plot the ionic column density solution derived for both ions. The AOD model solution is computed on the red component of the doublet. Velocity bins in which the PC solution has been corrected to account for the shallowness of the trough are denoted with crosses (see text).
Current usage metrics show cumulative count of Article Views (full-text article views including HTML views, PDF and ePub downloads, according to the available data) and Abstracts Views on Vision4Press platform.
Data correspond to usage on the plateform after 2015. The current usage metrics is available 48-96 hours after online publication and is updated daily on week days.
Initial download of the metrics may take a while.