Fig. 3
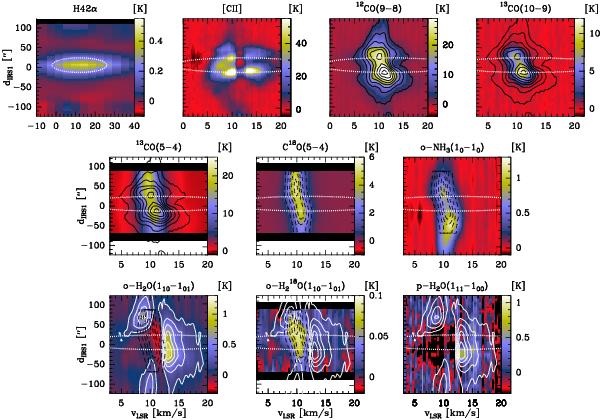
Position-velocity diagrams along the observed strip (Fig. 1) after continuum subtraction. The origin of the position axis is the IF and the negative direction extend SW of the origin. The dotted white ellipse indicates the size of the H ii region. Black solid contours in the CO panels trace the intensity of 12CO (9 → 8) emission from 2 to 37 K, in steps of 5 K. Dashed black contours display the intensity of the C18O (5 → 4) line from 1 to 6 K in linear steps of 1 K. The white solid contours represent the o-H2O emission from 0.1 to 0.9 K in steps of 0.2 K.
Current usage metrics show cumulative count of Article Views (full-text article views including HTML views, PDF and ePub downloads, according to the available data) and Abstracts Views on Vision4Press platform.
Data correspond to usage on the plateform after 2015. The current usage metrics is available 48-96 hours after online publication and is updated daily on week days.
Initial download of the metrics may take a while.