Free Access
Fig. 2
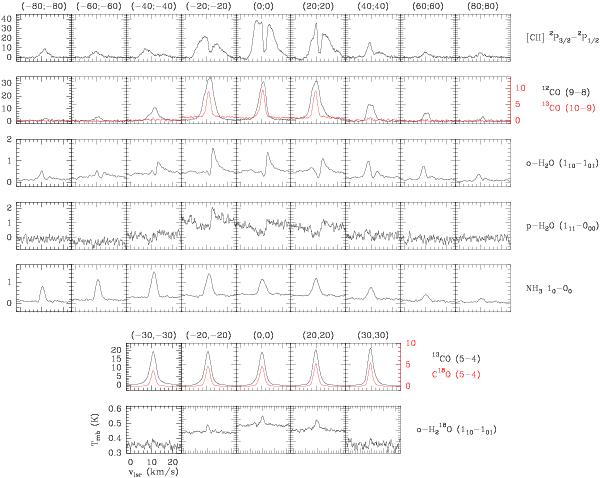
Raw spectra of the HIFI observations along the cut indicated in Fig. 1. The continuum has not been subtracted so that the offset in the intensity scale represent the observed continuum. This needs to be divided by two because of the double side band observations.
Current usage metrics show cumulative count of Article Views (full-text article views including HTML views, PDF and ePub downloads, according to the available data) and Abstracts Views on Vision4Press platform.
Data correspond to usage on the plateform after 2015. The current usage metrics is available 48-96 hours after online publication and is updated daily on week days.
Initial download of the metrics may take a while.