Fig. 1
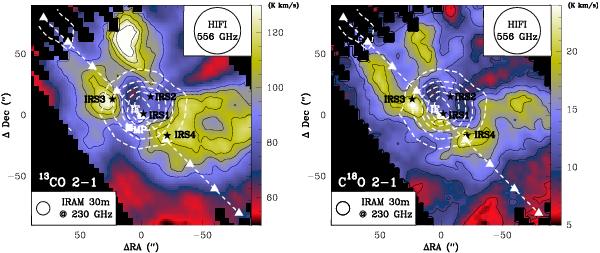
Maps of the integrated intensity (color scale) between 5 and 15 km s-1 of the 13CO (2 → 1, left) and C18O (2 → 1, right) lines observed at the IRAM-30 m telescope. Dashed white contours represent the integrated intensity of the H42α recombination line at 85.688 GHz (1 to 11 K km s-1 in steps of 2 K km s-1), tracing the H ii region. Squares represent the positions of the ionization front (IF) and the molecular peak (MP), whereas the triangles represent the points of the observed strip (dashed line) for 12CO (9 → 8), H2O and NH3 that are studied in this work. The infrared sources are indicated with black stars.
Current usage metrics show cumulative count of Article Views (full-text article views including HTML views, PDF and ePub downloads, according to the available data) and Abstracts Views on Vision4Press platform.
Data correspond to usage on the plateform after 2015. The current usage metrics is available 48-96 hours after online publication and is updated daily on week days.
Initial download of the metrics may take a while.