Fig. 3
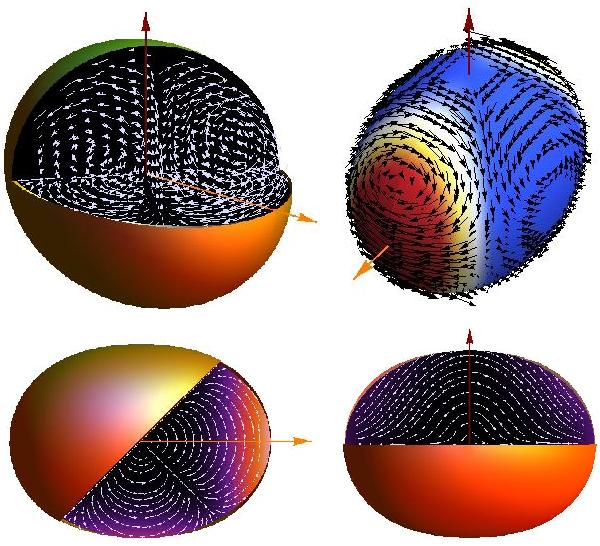
Top-left: three-dimensional view of the total (poloidal and toroidal) adiabatic equilibrium tide velocity field (white arrows). The red and orange arrows indicate the direction of the primary’s rotation axis and the line of centers, respectively. Top-right: representation of this velocity field at the surface of the primary (black arrows); the color-scaled background represents the normalized tidal potential intensity (blue and red for the minimum and maximum values, respectively). Bottom-left: view of the velocity field (white arrows) in its equatorial plane of symmetry; the color-scaled background represents the velocity value (black and orange for the minimum and maximum values, respectively). Bottom-right: view of the velocity field (white arrows) in its meridional plane of symmetry; the color-scaled background represents the velocity value (black and purple for the minimum and maximum values, respectively).
Current usage metrics show cumulative count of Article Views (full-text article views including HTML views, PDF and ePub downloads, according to the available data) and Abstracts Views on Vision4Press platform.
Data correspond to usage on the plateform after 2015. The current usage metrics is available 48-96 hours after online publication and is updated daily on week days.
Initial download of the metrics may take a while.