Fig. 4
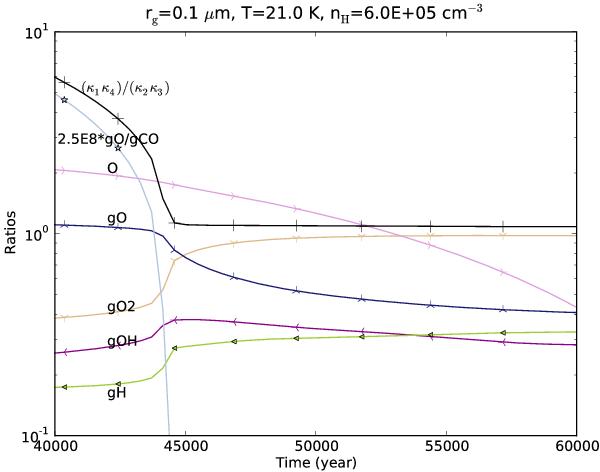
Corrected version of Fig. A.2 in Du et al. (2012). The ratios (κ1κ4)/(κ2κ3) and 2.5 × 10⁸ gO/gCO are used in the text to explain the appearance of the spike-like feature in the evolution curves, where 2.5 × 10⁸ is the ratio between two related reaction rates. The abundances of a few other species are plotted for reference (not to scale).
Current usage metrics show cumulative count of Article Views (full-text article views including HTML views, PDF and ePub downloads, according to the available data) and Abstracts Views on Vision4Press platform.
Data correspond to usage on the plateform after 2015. The current usage metrics is available 48-96 hours after online publication and is updated daily on week days.
Initial download of the metrics may take a while.