Fig. 4
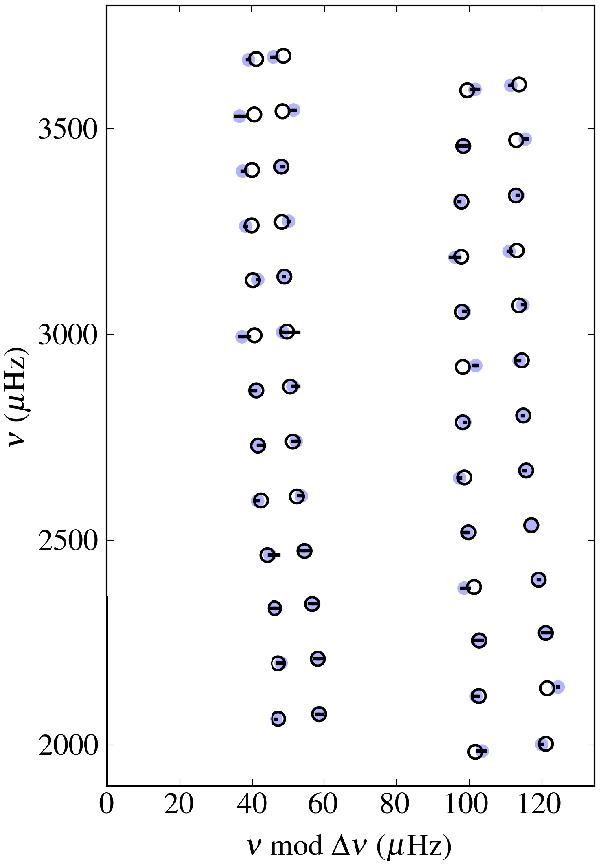
Echelle diagram for 18 Sco. The blue dots represent the frequencies given in Table 3. The 68.3% credible interval are also represented. The black circles show the scaled BiSON frequencies for the Sun (their best-fitting model, Table 1 in Broomhall et al. 2009). To plot this échelle diagram, we used the value of the large separation given in Paper I.
Current usage metrics show cumulative count of Article Views (full-text article views including HTML views, PDF and ePub downloads, according to the available data) and Abstracts Views on Vision4Press platform.
Data correspond to usage on the plateform after 2015. The current usage metrics is available 48-96 hours after online publication and is updated daily on week days.
Initial download of the metrics may take a while.