Fig. 6
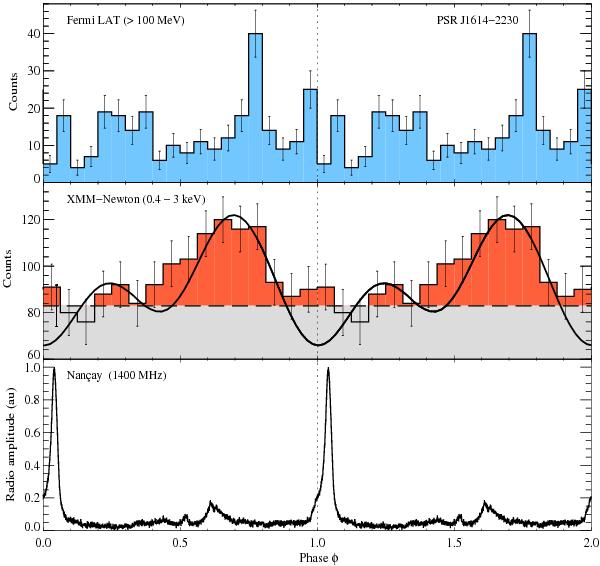
Top panel: Fermi LAT γ-ray phasogram from Abdo et al. (2009b), 20 bins per period. Middle: pn X-ray lightcurve of J1614−2230 (0.4−3.0 keV) overplotted with the model and parameters described in Sect. 4 (black solid line). The phasogram is shown with 16 bins per period and the dotted line corresponds to the background level. The error bars indicate the statistical 1σ error. Bottom: the Nançay 1400 MHz radio lightcurve. All plots show absolute phase.
Current usage metrics show cumulative count of Article Views (full-text article views including HTML views, PDF and ePub downloads, according to the available data) and Abstracts Views on Vision4Press platform.
Data correspond to usage on the plateform after 2015. The current usage metrics is available 48-96 hours after online publication and is updated daily on week days.
Initial download of the metrics may take a while.