Fig. 5
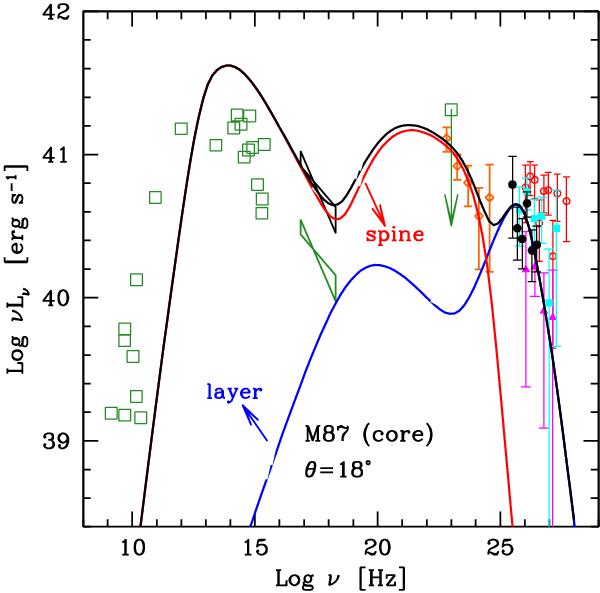
SED of the core of M 87 (green open squares) together with the MAGIC data points (black filled circles). For comparison we report the H.E.S.S. spectra taken in 2004 (magenta trangles) and 2005 (red open circles), from Aharonian et al. (2006), and the VERITAS spectrum taken in 2007 (Acciari et al. 2008, cyan filled squares). The green bow-tie reports the X-ray spectrum as measured by Chandra in 2000 (from Balmaverde et al. 2006). As in Tavecchio & Ghisellini (2008) we reproduced the X-ray emission of the period 2005–2007 assuming the same slope and a higher normalization (black bow-tie). In the high-energy γ-ray range the green open square corresponds to the EGRET upper limit and the orange diamonds to the Fermi-LAT energy spectrum from Abdo et al. (2009). The lines report the emission from the spine (red) and from the layer (blue), calculated with the parameters reported in Table 2, and their sum (black).
Current usage metrics show cumulative count of Article Views (full-text article views including HTML views, PDF and ePub downloads, according to the available data) and Abstracts Views on Vision4Press platform.
Data correspond to usage on the plateform after 2015. The current usage metrics is available 48-96 hours after online publication and is updated daily on week days.
Initial download of the metrics may take a while.