Fig. 4
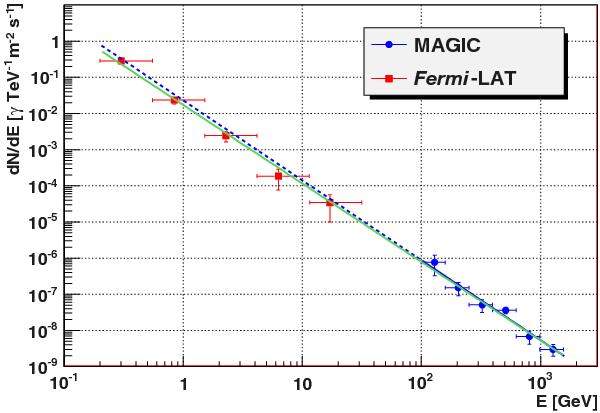
Combined Fermi-LAT and MAGIC differential energy spectrum over four orders of magnitude in energy starting from 100 MeV until 2 TeV. The Fermi-LAT spectrum was obtained from Abdo et al. (2009). The blue dashed line corresponds to the extrapolation of the fit to the MAGIC data points into the Fermi-LAT energy range, while the green line represents the combined fit to the MAGIC and Fermi-LAT data. No break or change in the spectral slope is apparent and both fits are statistically compatible. Note that the two observations are not contemporaneous, but Abdo et al. (2009) concluded that the source was most likely in a low-emission state during the observations.
Current usage metrics show cumulative count of Article Views (full-text article views including HTML views, PDF and ePub downloads, according to the available data) and Abstracts Views on Vision4Press platform.
Data correspond to usage on the plateform after 2015. The current usage metrics is available 48-96 hours after online publication and is updated daily on week days.
Initial download of the metrics may take a while.