Free Access
Fig. 3
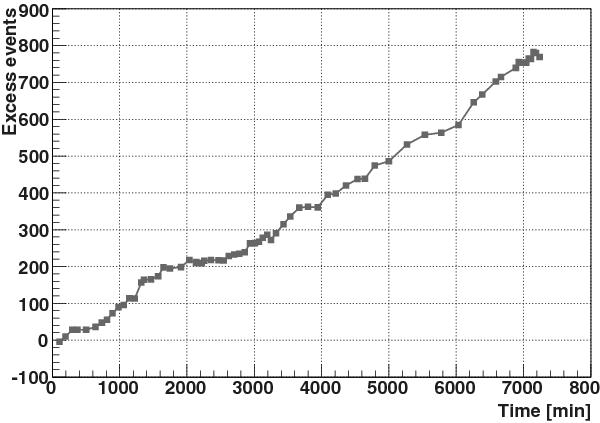
Evolution of excess events from M 87 over dead-time-corrected observing time. The linear increase is consistent with a constant flux of the source during the entire observing campaign. Only wobble data are shown in this figure in order to reduce systematic uncertainties in the ON-OFF subtraction.
Current usage metrics show cumulative count of Article Views (full-text article views including HTML views, PDF and ePub downloads, according to the available data) and Abstracts Views on Vision4Press platform.
Data correspond to usage on the plateform after 2015. The current usage metrics is available 48-96 hours after online publication and is updated daily on week days.
Initial download of the metrics may take a while.