Free Access
Fig. 2
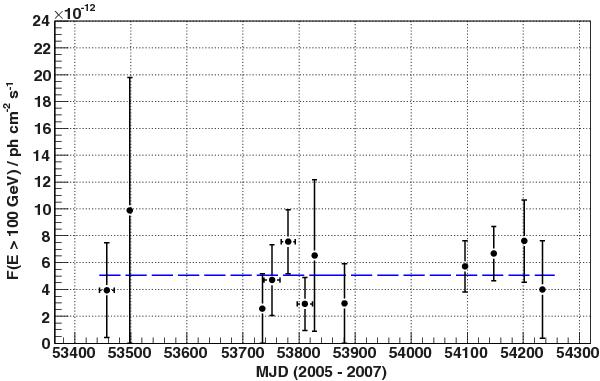
Light curve of the integral γ-ray flux above 100 GeV during the 2005–2007 MAGIC observing period. The dashed blue line corresponds to the fit result of a linear function to the data points, with a reduced χ2/d.o.f. = 5.66/11 and an average flux of (5.06 ± 0.77) × 10-12 s-1 cm-2.
Current usage metrics show cumulative count of Article Views (full-text article views including HTML views, PDF and ePub downloads, according to the available data) and Abstracts Views on Vision4Press platform.
Data correspond to usage on the plateform after 2015. The current usage metrics is available 48-96 hours after online publication and is updated daily on week days.
Initial download of the metrics may take a while.