Fig. 1
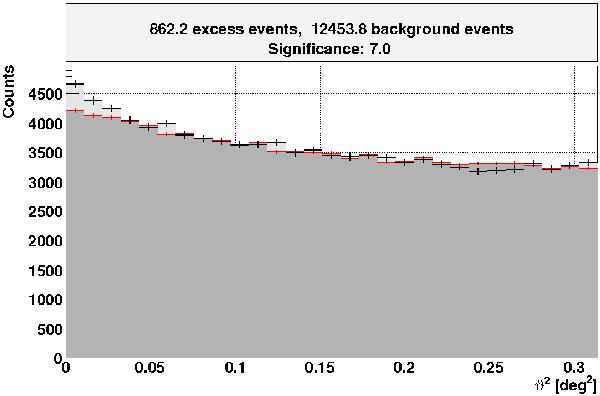
ϑ2 distribution of the combined 128.6 h MAGIC observations between 2005 and 2007. ϑ2 is the squared angular distance between the source position and the reconstructed arrival direction of each event. The grey shaded area below the red crosses is the OFF data-sample, while the black crosses correspond to the ON data. The excess is point-like compared to the PSF with a significance of 7 standard deviations (calculated with formula 17 of Li & Ma 1983).
Current usage metrics show cumulative count of Article Views (full-text article views including HTML views, PDF and ePub downloads, according to the available data) and Abstracts Views on Vision4Press platform.
Data correspond to usage on the plateform after 2015. The current usage metrics is available 48-96 hours after online publication and is updated daily on week days.
Initial download of the metrics may take a while.