Fig. 6
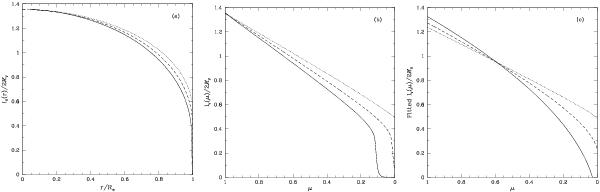
a) Surface-brightness distribution as a function of fractional radius. The solid line is the full set of intensities from a spherical model atmosphere with Teff = 5000 K, log g = 2.0 and M⋆ = 5 M⊙. The dashed line has removed intensity values for r/R⋆ ≥ 0.995 and then renormalized the fractional radius to the interval 0 − 1. The dotted line has removed intensity values for r/R⋆ ≥ 0.98 and then renormalized the fractional radius to the interval 0 − 1. b) Surface-brightness distributions from panel a) plotted as a function of μ, with the lines having the same meaning as in the a) panel. c) Fits to the surface-brightness distributions in panel b) using Eq. (2). The lines have the same meaning as the other two panels.
Current usage metrics show cumulative count of Article Views (full-text article views including HTML views, PDF and ePub downloads, according to the available data) and Abstracts Views on Vision4Press platform.
Data correspond to usage on the plateform after 2015. The current usage metrics is available 48-96 hours after online publication and is updated daily on week days.
Initial download of the metrics may take a while.