Fig. 10
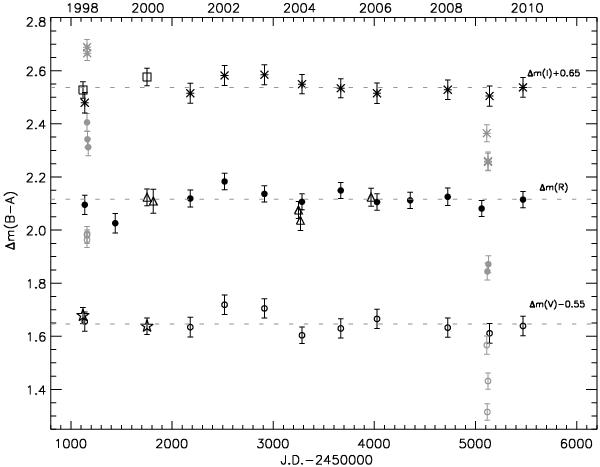
V, R and I-band magnitude differences between images A and B of UM673 for the 1998–2010 period. The measurements based on the ESO archive data are indicated by open stars, open triangles and open squares for the V, R and I bands, respectively. The Maidanak-CTIO magnitude differences are shown by open circles, filled circles and stars. The mean V, R and I-band magnitude differences are shown by dotted lines.
Current usage metrics show cumulative count of Article Views (full-text article views including HTML views, PDF and ePub downloads, according to the available data) and Abstracts Views on Vision4Press platform.
Data correspond to usage on the plateform after 2015. The current usage metrics is available 48-96 hours after online publication and is updated daily on week days.
Initial download of the metrics may take a while.