Fig. 4
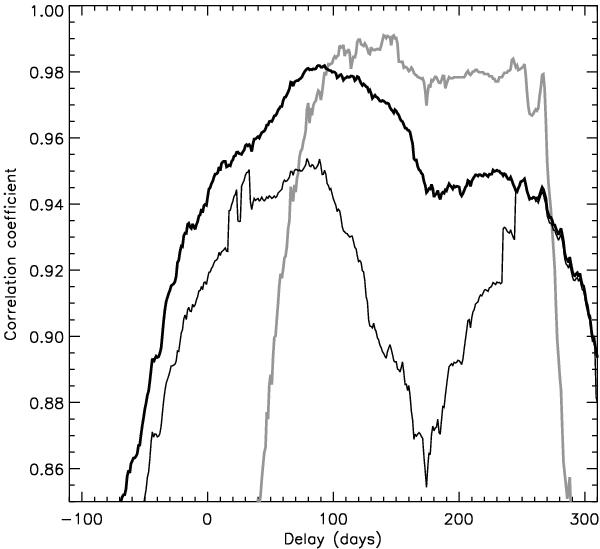
CCFs calculated between the R-band light curves of images A and B with the data points corresponding to the high-amplitude event in image B excluded (shown by a thick black line); and the data points corresponding to the high-amplitude event in image B included (shown by a thin black line). The CCF calculated between the R-band light curves corresponding to the 2003–2005 period is shown by a thick gray line.
Current usage metrics show cumulative count of Article Views (full-text article views including HTML views, PDF and ePub downloads, according to the available data) and Abstracts Views on Vision4Press platform.
Data correspond to usage on the plateform after 2015. The current usage metrics is available 48-96 hours after online publication and is updated daily on week days.
Initial download of the metrics may take a while.