Fig. 3
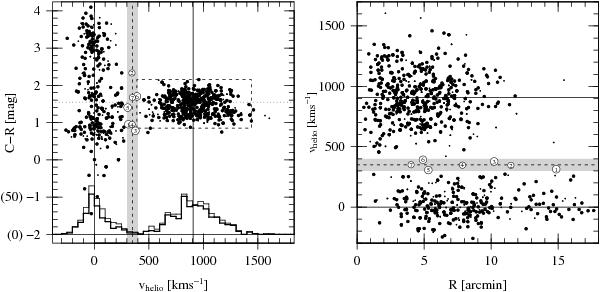
Velocity distributions: separating GCs from foreground stars. In both panels, the dashed line at 350 km s-1 shows the velocity cut used in Paper I, and the grey region has a width of 100 km s-1. In both panels, objects in this region are shown as white dots and numbered in decreasing order of the radial distance. The solid line indicates the systemic velocity of NGC 4636 (v = 906 km s-1). Left: colour vs. heliocentric velocity. The dashed box shows the range of parameters for the GCs analysed in Paper I (cf. Table 3 therein). Large symbols show objects with velocity uncertainties Δv ≤ 65 km s-1. The histograms (y-axis labels in parenthesis) have a bin width of 50 km s-1, and the thick line shows the objects with Δv ≤ 65 km s-1. Right: heliocentric velocity vs. projected galactocentric distance. Again, large symbols show objects with Δv ≤ 65 km s-1.
Current usage metrics show cumulative count of Article Views (full-text article views including HTML views, PDF and ePub downloads, according to the available data) and Abstracts Views on Vision4Press platform.
Data correspond to usage on the plateform after 2015. The current usage metrics is available 48-96 hours after online publication and is updated daily on week days.
Initial download of the metrics may take a while.