Fig. 22
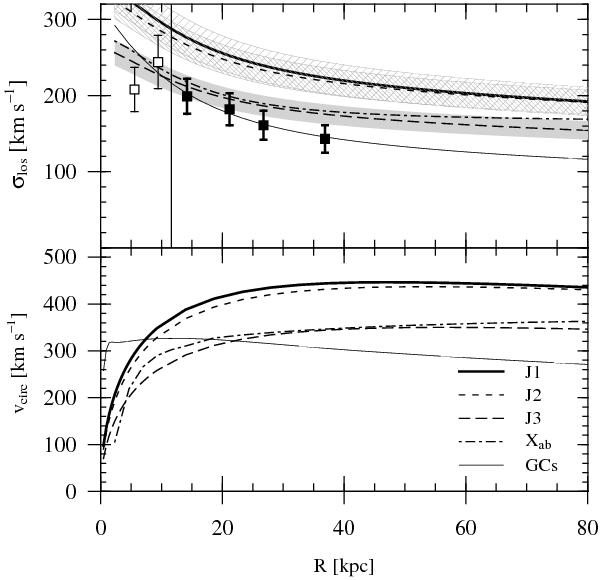
Comparison to the NFW halos derived by Johnson et al. (2009) with the parameters listed in Table 10. Upper panel: velocity dispersion profiles. The data points show our final blue GC sample (same as in Fig. 19, left panel but for a distance of 16 Mpc). The thick solid line shows model J1; model J2 is shown as short-dashed line, the dashed regions show the corresponding uncertainties. The long-dashed line is model J3, and the grey area shows the uncertainties. The dash-dotted line (labelled Xab) corresponds to the mass profile (incorporating the abundance gradient) shown in Fig. 4 of Johnson et al. The thin solid line is the best-fit model for the GCs (rs = 20 kpc, ϱs = 0.012, Υ ⋆ ,R = 6.4). Lower panel: circular velocity curves. The line styles are the same as in the upper panel.
Current usage metrics show cumulative count of Article Views (full-text article views including HTML views, PDF and ePub downloads, according to the available data) and Abstracts Views on Vision4Press platform.
Data correspond to usage on the plateform after 2015. The current usage metrics is available 48-96 hours after online publication and is updated daily on week days.
Initial download of the metrics may take a while.