Fig. 20
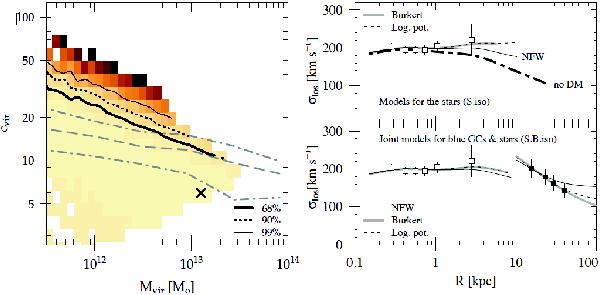
Modelling the stellar velocity dispersion profile. Left: Jeans models for the stars (Bender et al. 1994 data) for an NFW-type dark halo and β = 0. The parameters are shown in the (Mvir,cvir)-plane. The thick solid, dashed and thin solid lines indicate the 68, 90, and 99 per cent confidence limits. The cross indicates the location of the minimum χ2 value. The model parameters are listed in Table 9. The long-dashed (dash-dotted) lines show the median (68 per cent values) for simulated NFW halos as found by Bullock et al. (2001). Right: modelled velocity dispersion profiles for the stars (Bender et al. 1994 data, shown as unfilled squares). The upper sub-panel shows the best-fit isotropic models for the stars. The thin solid line shows the model for an NFW-type dark halo, and the thin dashed line is the model for the logarithmic potential. The Burkert halo is shown as thick grey line. The thick dot-dashed line is the model without dark matter. The lower sub-panel shows the joint models for the blue GCs and the stellar velocity dispersion profile (models S.B.iso). The line-styles are the same as in the upper panel. The black squares show the velocity dispersion profile for the blue GCs (sample BlueFinal). The halo parameters are given in Table 9.
Current usage metrics show cumulative count of Article Views (full-text article views including HTML views, PDF and ePub downloads, according to the available data) and Abstracts Views on Vision4Press platform.
Data correspond to usage on the plateform after 2015. The current usage metrics is available 48-96 hours after online publication and is updated daily on week days.
Initial download of the metrics may take a while.