Fig. 13
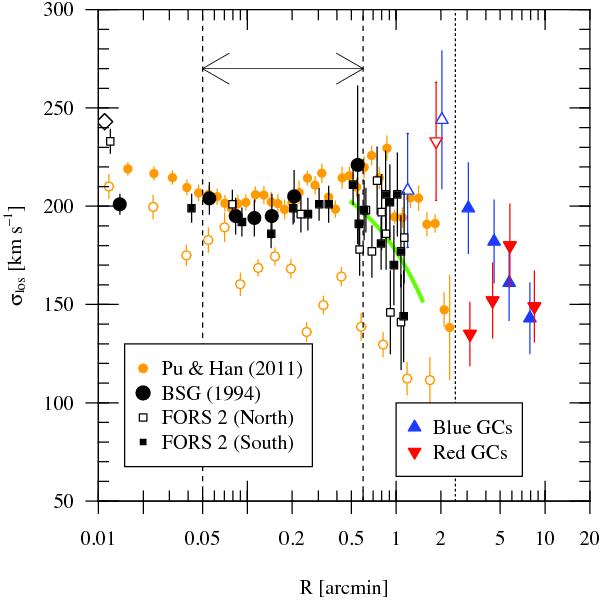
The stellar velocity dispersion profile of NGC 4636. The diamond is the central dispersion measured by Proctor & Sansom (2002). Large dots show the values from Bender et al. (1994), squares are the values derived from our FORS 2 spectra (see text for details). Unfilled (filled) squares indicate slits North (South) of the galaxy centre. The vertical dashed lines indicate the region we use to model the galaxy’s velocity dispersion profile (cf. Sect. 11.1.3). The solid green curve is a linear fit to the data for  . The major axis measurements by Pu & Han (2011) are shown as small (orange) dots. For radii ≤ 0.219′, where the long slit extends to either side of the galaxy, we plot the averaged values; the uncertainties were added in quadrature. For comparison, the data points for blue and red GCs for constant number bins (final samples, values from Table 7) are shown as triangles. The vertical dotted line at
  marks the radius inside which blue and red GCs cannot be separated.
Current usage metrics show cumulative count of Article Views (full-text article views including HTML views, PDF and ePub downloads, according to the available data) and Abstracts Views on Vision4Press platform.
Data correspond to usage on the plateform after 2015. The current usage metrics is available 48-96 hours after online publication and is updated daily on week days.
Initial download of the metrics may take a while.