Fig. 12
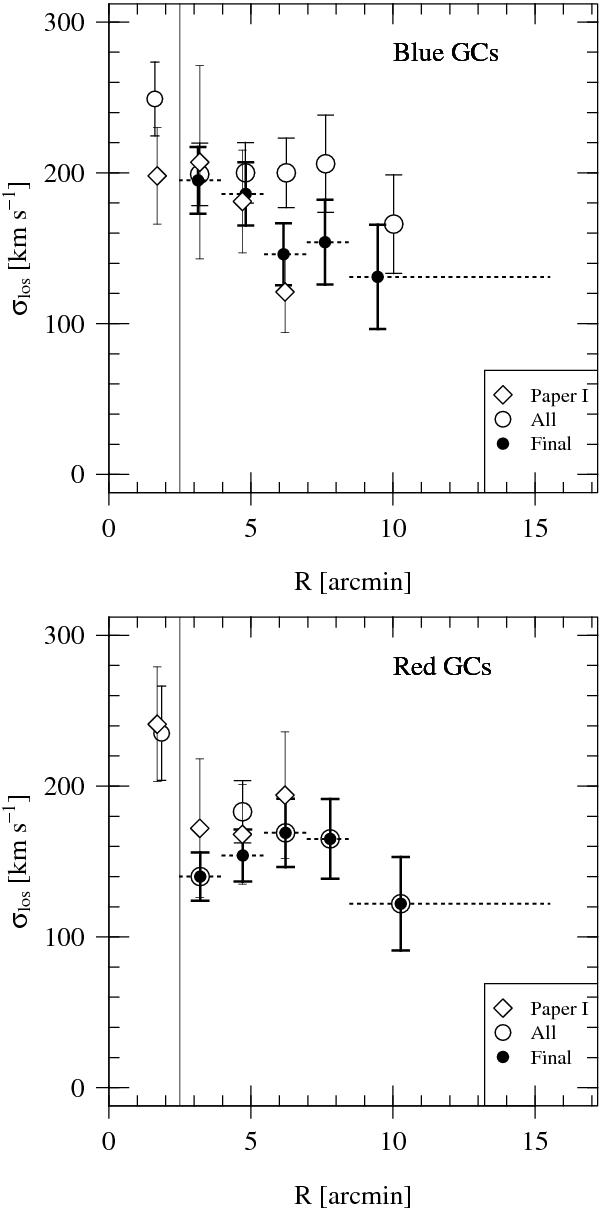
Velocity dispersion profiles. Upper panel: circles show the dispersion values for the blue GCs (for fixed radial bins cf. Table 6) prior to quality selection and outlier removal. Dots are the values for the final blue sample. The dashed horizontal “error bars” indicate the radial range of a given bin; the bins used here are the ones indicated by the dotted lines in the lower panels of Fig. 8. The dispersion values from Paper I are shown as diamonds. In both panels, the vertical line at 2 5 indicates the first bin which covers the radius inside which blue and red GCs cannot be distinguished. Lower panel: the same for the red GCs.
Current usage metrics show cumulative count of Article Views (full-text article views including HTML views, PDF and ePub downloads, according to the available data) and Abstracts Views on Vision4Press platform.
Data correspond to usage on the plateform after 2015. The current usage metrics is available 48-96 hours after online publication and is updated daily on week days.
Initial download of the metrics may take a while.