Free Access
Fig. 2
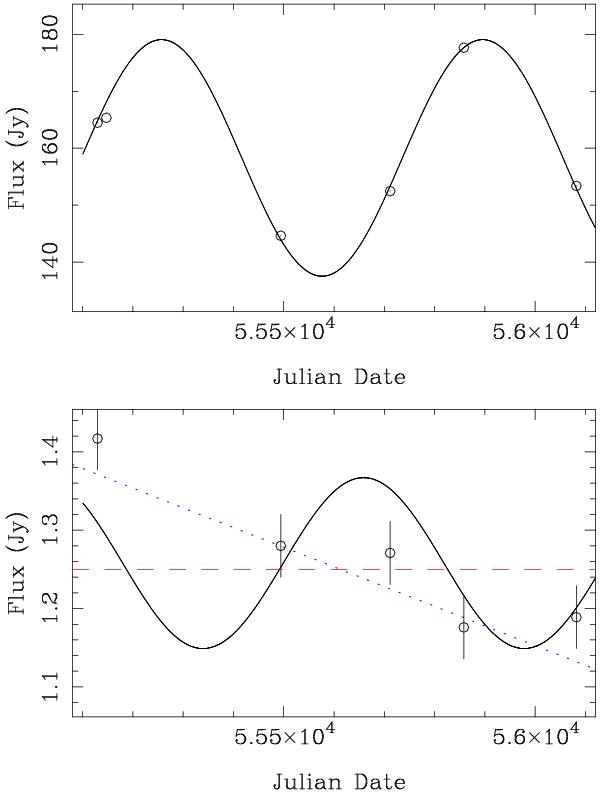
Observations and fitted sinusoidal curve to the SPIRE PSW 250 μm data on the central star (top panel), and the bow shock (lower panel). The bottom panel also includes the best fit to the data using a constant (the red dashed line), and a line (the blue dotted line).
This figure is made of several images, please see below:
Current usage metrics show cumulative count of Article Views (full-text article views including HTML views, PDF and ePub downloads, according to the available data) and Abstracts Views on Vision4Press platform.
Data correspond to usage on the plateform after 2015. The current usage metrics is available 48-96 hours after online publication and is updated daily on week days.
Initial download of the metrics may take a while.