Fig. 8
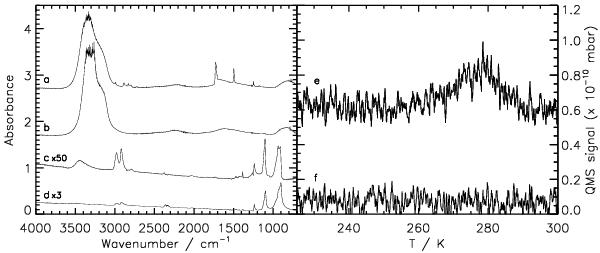
Spectra of polyoxymethylene (POM, -CH2-O-n). Left hand panel: IR spectra a) IR spectrum taken at 100 K (H2CO:H2O mixture deposited at 90 K). b) an IR spectrum taken at 145 K during the same TPD. c) an IR spectrum taken at 215 K. d) a reference spectrum of POM taken at 300 K. Right hand panel: mass spectra e) m/z 30. f) m/z 60.
Current usage metrics show cumulative count of Article Views (full-text article views including HTML views, PDF and ePub downloads, according to the available data) and Abstracts Views on Vision4Press platform.
Data correspond to usage on the plateform after 2015. The current usage metrics is available 48-96 hours after online publication and is updated daily on week days.
Initial download of the metrics may take a while.