Fig. 7
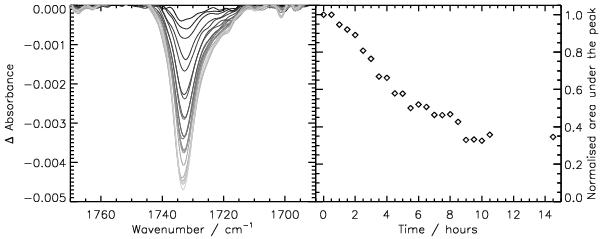
Left hand panel: difference spectra of the H2CO stretching mode absorption at 1735 cm-1 while the surface is held at 135 K. These data correspond to trace b in Fig. 6. Black corresponds to time =0, light grey corresponds to time =14.5 h. Right hand panel: these data are the calculated area under the peak for the same absorption band, plotted as a function of time held at 135 K.
Current usage metrics show cumulative count of Article Views (full-text article views including HTML views, PDF and ePub downloads, according to the available data) and Abstracts Views on Vision4Press platform.
Data correspond to usage on the plateform after 2015. The current usage metrics is available 48-96 hours after online publication and is updated daily on week days.
Initial download of the metrics may take a while.