Fig. 6
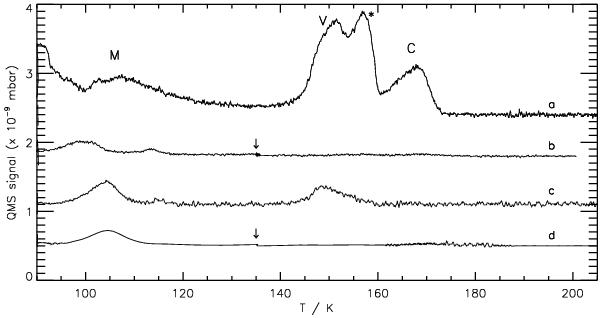
TPD spectra (m/z = 30) for the H2CO:H2O mixtures, a) 1:14 deposited at 15 K, heated at 2 K min-1 90 − 210 K, b) 1:8 deposited at 15 K, heated at 2 K min-1 90 − 135 K, held at 135 K for 14.5 h, heated at 2 K min-1 135 − 210 K, c) 1:6 deposited at 90 K, heated at 2 K min-1 90 − 210 K, d) 1:9 deposited at 90 K, heated at 2 K min-1 90 − 135 K, held at 135 K for 18 h, heated at 2 K min-1 135 − 210 K. The arrows indicate that an isothermal break of several hours was made in the TPD experiment. M, V, and C correspond to the multilayer, the volcano and co-desorption desorptions, respectively. The asterisk indicates a double peaked structure, observed as a result of desorption of H2CO from the radiation shield.
Current usage metrics show cumulative count of Article Views (full-text article views including HTML views, PDF and ePub downloads, according to the available data) and Abstracts Views on Vision4Press platform.
Data correspond to usage on the plateform after 2015. The current usage metrics is available 48-96 hours after online publication and is updated daily on week days.
Initial download of the metrics may take a while.