Free Access
Fig. 5
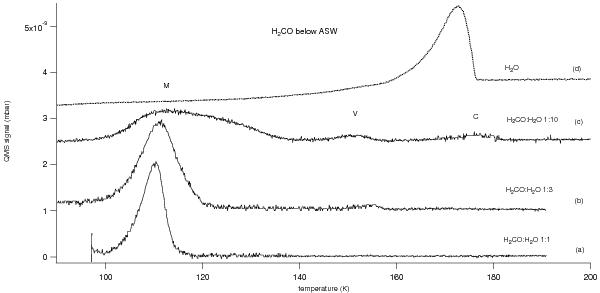
Temperature-programmed desorption curves (m/z 30) of three H2O/H2CO layered systems where an ASW film is on top of a H2CO film in varying H2O/H2CO abundance ratios: a) 1/1, b) 3/1 and c) 10/1. The M, V and C features are visible on the TPD curves. d) TPD curve (m/z 18) of H2O (scaled × 0.125).
Current usage metrics show cumulative count of Article Views (full-text article views including HTML views, PDF and ePub downloads, according to the available data) and Abstracts Views on Vision4Press platform.
Data correspond to usage on the plateform after 2015. The current usage metrics is available 48-96 hours after online publication and is updated daily on week days.
Initial download of the metrics may take a while.