Fig. 5
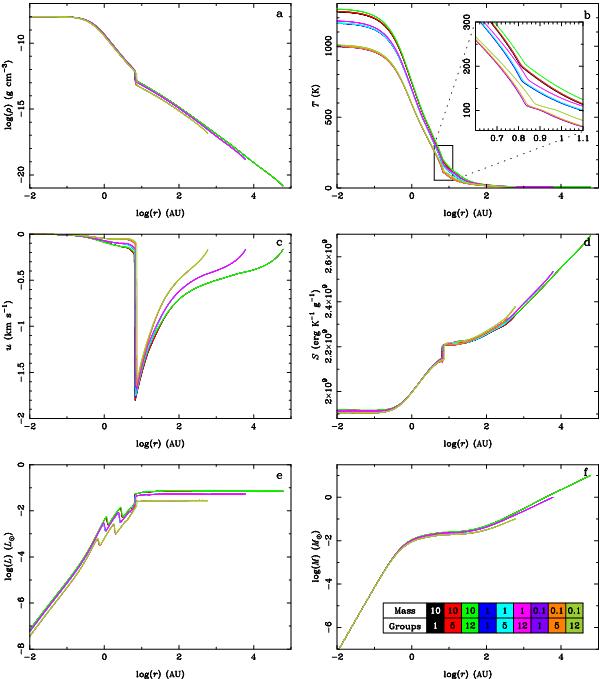
Comparison of the radial profiles during the collapse of a 0.1 M⊙, 1 M⊙, and 10 M⊙ dense cloud for a core central density ρc = 10-8 g cm-3. From top left to bottom right: a) density; b) gas temperature; c) velocity; d) entropy; e) radiative flux; and f) enclosed mass. The legend in the f) panel explains the curve colour-coding: the top row is the mass of the initial cloud and the bottom row is the number of frequency groups used in each simulation.
Current usage metrics show cumulative count of Article Views (full-text article views including HTML views, PDF and ePub downloads, according to the available data) and Abstracts Views on Vision4Press platform.
Data correspond to usage on the plateform after 2015. The current usage metrics is available 48-96 hours after online publication and is updated daily on week days.
Initial download of the metrics may take a while.