Fig. 3
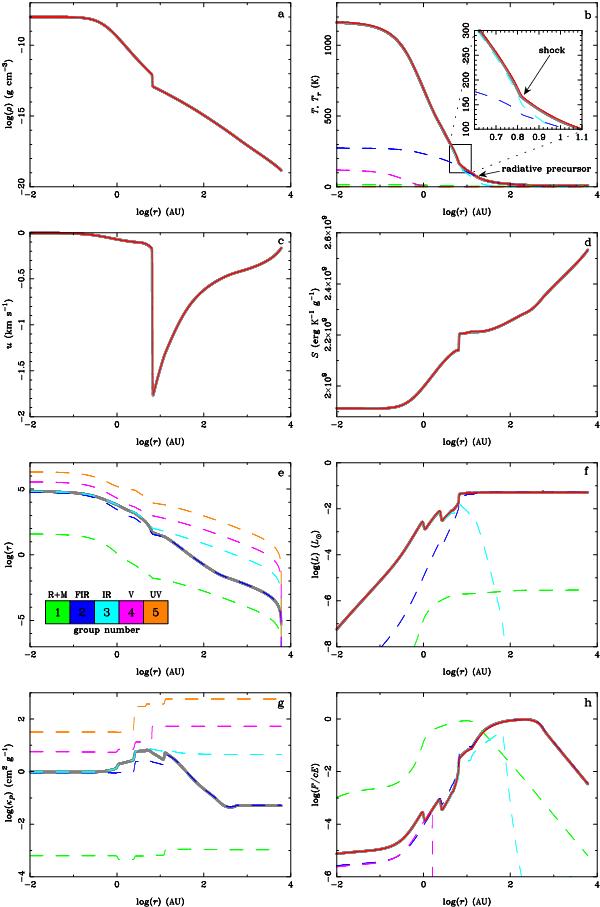
Radial profiles of various properties during the collapse of a 1 M⊙ dense clump at a core central density ρc = 10-8 g cm-3 for the grey (grey thick solid line) and multigroup (colours) models. For the multigroup run, the gas and total radiative (summed over all groups) quantities are plotted in red, while the other colours represent the individual groups; see legend in e). From top left to bottom right: a) density; b) gas (solid) and radiation (dashed) temperature; c) velocity; d) entropy; e) optical depth; f) luminosity; g) Planck average opacity; and h) reduced radiative flux.
Current usage metrics show cumulative count of Article Views (full-text article views including HTML views, PDF and ePub downloads, according to the available data) and Abstracts Views on Vision4Press platform.
Data correspond to usage on the plateform after 2015. The current usage metrics is available 48-96 hours after online publication and is updated daily on week days.
Initial download of the metrics may take a while.