Free Access
Fig. 2
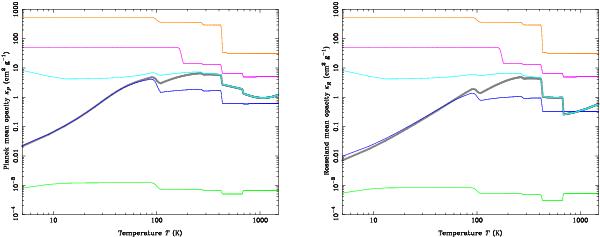
Planck (left) and Rosseland (right) mean opacities as a function of temperature for the grey (thick grey) and multigroup (colours) simulations. The sharp discontinuities seen in the curves are due to transitions from one temperature range to the other, corresponding to the destruction of ice, silicates, etc.
Current usage metrics show cumulative count of Article Views (full-text article views including HTML views, PDF and ePub downloads, according to the available data) and Abstracts Views on Vision4Press platform.
Data correspond to usage on the plateform after 2015. The current usage metrics is available 48-96 hours after online publication and is updated daily on week days.
Initial download of the metrics may take a while.