Fig. 1
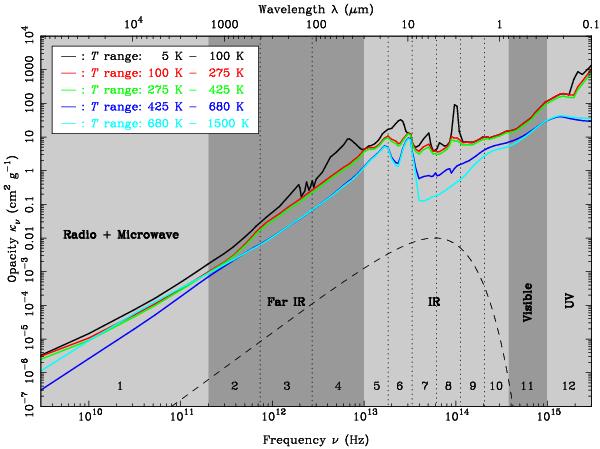
Spectral opacities for homogeneous spherical dust grains taken from Semenov et al. (2003) for five different temperature ranges. The grey colour bands represent the five different frequency groups that were used in the multigroup simulation. The dotted vertical lines indicate the additional splitting of groups 2 and 3 in the case of the 12-group simulation. The dashed line represents the Planck function for a black body with a typical temperature of 1000 K normalised to arbitrary units. The numbers in the lower part of the figure identify the different groups used in the 12-group simulation (see Sect. 3).
Current usage metrics show cumulative count of Article Views (full-text article views including HTML views, PDF and ePub downloads, according to the available data) and Abstracts Views on Vision4Press platform.
Data correspond to usage on the plateform after 2015. The current usage metrics is available 48-96 hours after online publication and is updated daily on week days.
Initial download of the metrics may take a while.