Free Access
Fig. 8
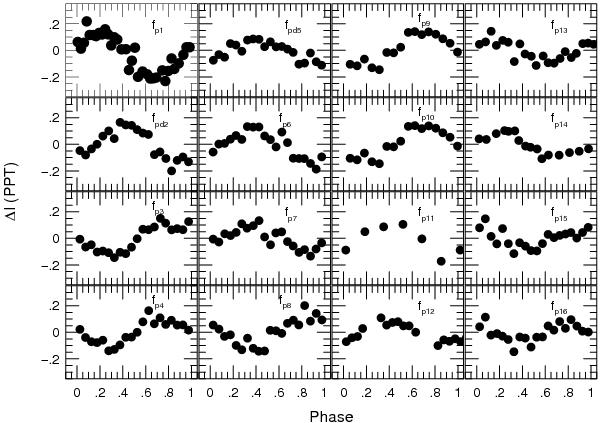
Phase diagrams showing the residual photometric measurements phased to the frequencies found in the Fourier analysis. For each panel the contribution of all other frequencies were subtracted prior to phasing the data. Data were phased in phase bins of 0.05 except for fp11 where a bin of 0.1 was used.
Current usage metrics show cumulative count of Article Views (full-text article views including HTML views, PDF and ePub downloads, according to the available data) and Abstracts Views on Vision4Press platform.
Data correspond to usage on the plateform after 2015. The current usage metrics is available 48-96 hours after online publication and is updated daily on week days.
Initial download of the metrics may take a while.