Free Access
Fig. 6
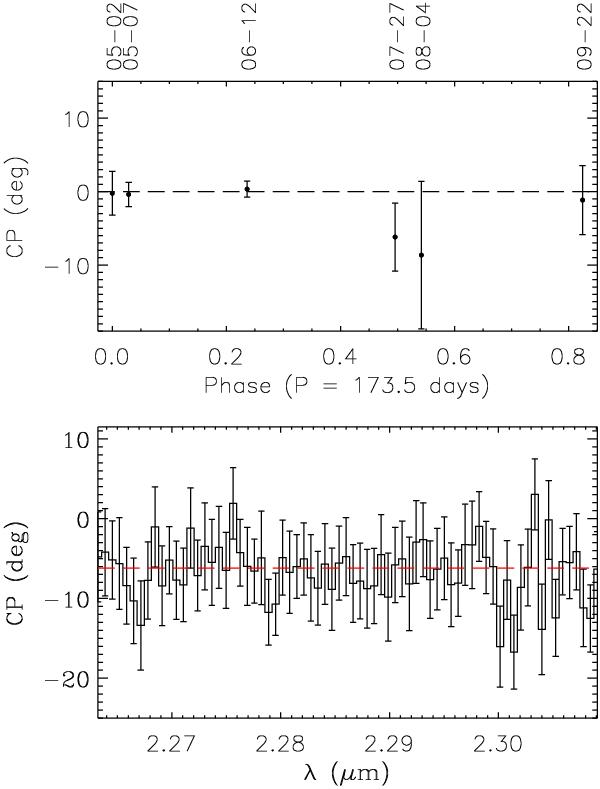
The wavelength-averaged calibrated closure phase for each observing date (top panel) and an example of the closure phase data (data obtained on the 27th of June, lower panel). The data have been re-binned by approximately twice the resolution element.
This figure is made of several images, please see below:
Current usage metrics show cumulative count of Article Views (full-text article views including HTML views, PDF and ePub downloads, according to the available data) and Abstracts Views on Vision4Press platform.
Data correspond to usage on the plateform after 2015. The current usage metrics is available 48-96 hours after online publication and is updated daily on week days.
Initial download of the metrics may take a while.