Fig. 5
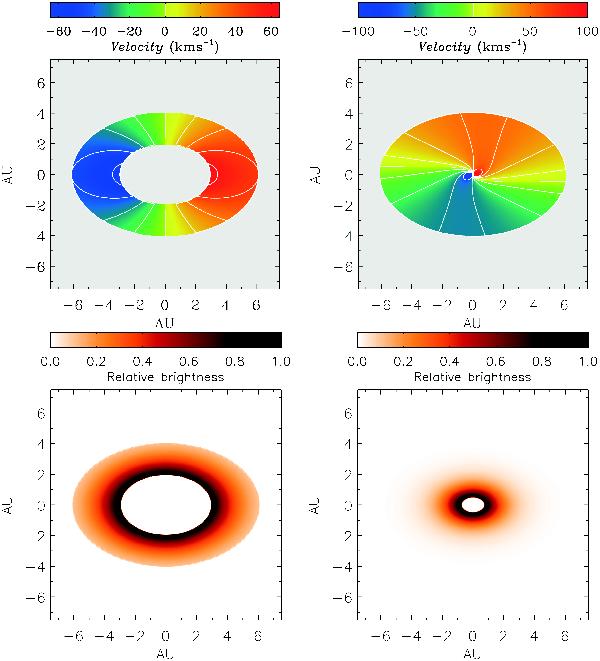
A comparison between the velocity structure (upper row) and brightness distribution (lower row) of the best fitting disc (left column) and equatorial outflow (right column) models. The contours in disc velocity image are drawn at: 15, 30, 45 and 60 km s-1 and the contour levels of the outflow velocity image are: 10, 30, 50 and 70 km s-1. The maximum velocity shown in the outflow image is 100 km s-1, but the velocity at the inner edge of the structure is ~400 km s-1. The brightness distributions are normalised to the contribution of the brightest element.
Current usage metrics show cumulative count of Article Views (full-text article views including HTML views, PDF and ePub downloads, according to the available data) and Abstracts Views on Vision4Press platform.
Data correspond to usage on the plateform after 2015. The current usage metrics is available 48-96 hours after online publication and is updated daily on week days.
Initial download of the metrics may take a while.