Fig. 3
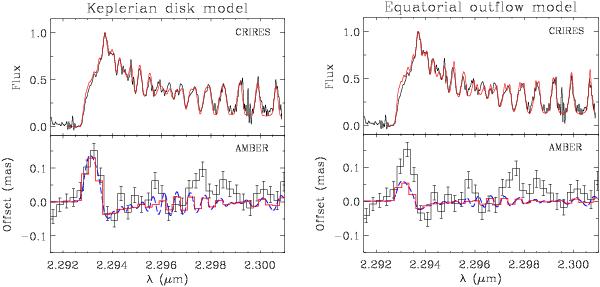
A comparison between the observations and the two physically different best fitting models explored in the text. The upper panels present the average CRIRES spectrum and the profile of the best fitting model. In the lower panels, the observed photo-centre offsets calculated using AMBER differential phase measurements from the baseline with the lowest noise level (D0-A1 used on the 7th of May) are shown. For each model that fits the CRIRES spectrum we over-plot the predicted signature for the selected baseline. The model signatures are smoothed to the spectral resolution of AMBER and are shown re-binned using the size of the AMBER pixels and with a finer sampling.
Current usage metrics show cumulative count of Article Views (full-text article views including HTML views, PDF and ePub downloads, according to the available data) and Abstracts Views on Vision4Press platform.
Data correspond to usage on the plateform after 2015. The current usage metrics is available 48-96 hours after online publication and is updated daily on week days.
Initial download of the metrics may take a while.