Fig. 2
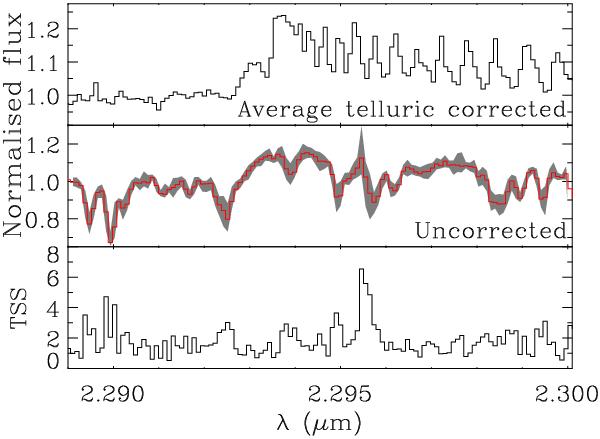
The upper panel presents the time-averaged, telluric corrected AMBER spectrum. The central panel contains the un-processed (not corrected for telluric absorption) AMBER spectrum. The shaded region represents the scatter of the six average spectra constructed for each observing date. The lower panel presents the temporal sigma spectrum.
Current usage metrics show cumulative count of Article Views (full-text article views including HTML views, PDF and ePub downloads, according to the available data) and Abstracts Views on Vision4Press platform.
Data correspond to usage on the plateform after 2015. The current usage metrics is available 48-96 hours after online publication and is updated daily on week days.
Initial download of the metrics may take a while.