Free Access
Fig. 4
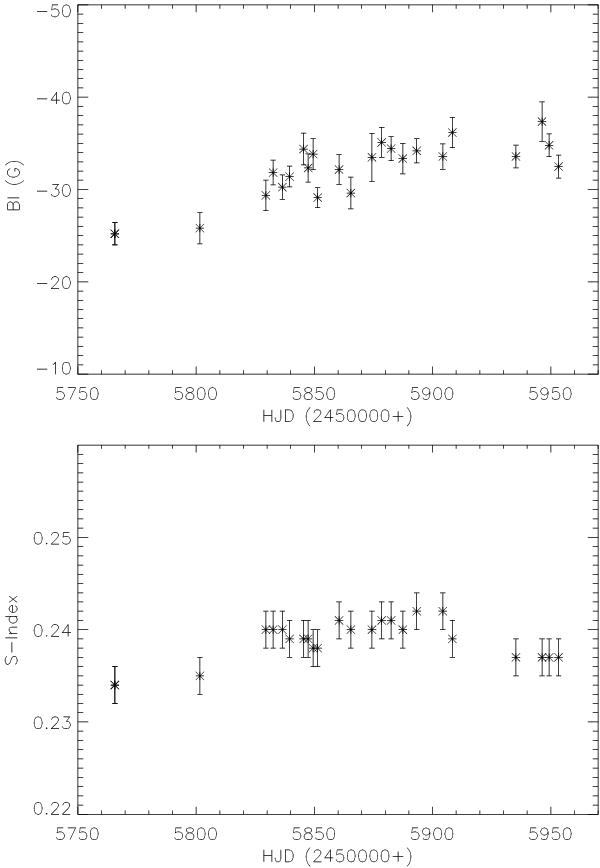
Variations in the average longitudinal magnetic field and the S-index of 14 Ceti with the Julian date during the 2011 − 2012 season. The errors in Bl are taken from Table 1, and for the S-index an error of 0.002 is illustrated.
This figure is made of several images, please see below:
Current usage metrics show cumulative count of Article Views (full-text article views including HTML views, PDF and ePub downloads, according to the available data) and Abstracts Views on Vision4Press platform.
Data correspond to usage on the plateform after 2015. The current usage metrics is available 48-96 hours after online publication and is updated daily on week days.
Initial download of the metrics may take a while.