Fig. 8
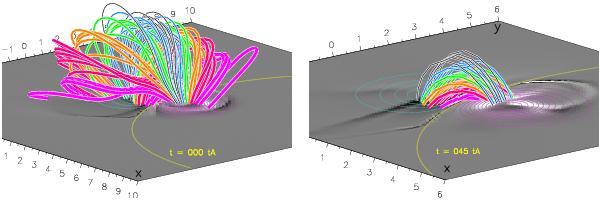
Three-dimensional view of field lines before and after they have reconnected. Right: distribution along the PIL of post-flare loops at t = 45 tA. Each field line is color-coded accordingly with the altitude z = 0.1,0.2,...,1,1.1 of its apex. Left: progenitor field lines at t = 0, plotted from the same footpoints at z = 0 of same the post flare loops as drawn in the right panel. In both panels, a differential shear is present, with a shear decreasing away from the PIL.
Current usage metrics show cumulative count of Article Views (full-text article views including HTML views, PDF and ePub downloads, according to the available data) and Abstracts Views on Vision4Press platform.
Data correspond to usage on the plateform after 2015. The current usage metrics is available 48-96 hours after online publication and is updated daily on week days.
Initial download of the metrics may take a while.